


Saturday, August 9, 2008
Targets are measured in a similar fashion to Double Tops and Double Bottoms and they are traded in the same manner.
For a triple top, volume is high on the first peak and low on the third. There is an increase in volume on the second trough and a sharp increase at the breakout.
A triple bottom requires high volume on the first trough reducing to low volume on the third. Volume increases on the second peak and again on the breakout.
Trading Signals
 Go short on a break below the support line.
Place a stop-loss just above the last peak.
Price often rallies back to the support line which then acts as a resistance level. Go short on a reversal signal and place a stop-loss just above the resistance level.
Go long on a break above the resistance line.
Place a stop-loss just below the last trough.
Price often corrects back to the resistance line which then acts as a support level. Go short on a reversal signal and place a stop-loss just below the support level.

Volume Confirmation
· High volume on the first peak,
· Moderate volume on the middle peak,
· Low volume on the third peak, and
· A sharp increase in volume on the break below the neckline.
Place a stop-loss just above the last peak.
After the breakout, price often rallies back to the neckline which then acts as a resistance level. Go short on a reversal signal and place a stop-loss one tick above the resistance level.
Never trust a head and shoulders pattern where the neckline is clearly ascending (the second trough being higher than the first). Also, the more level the neckline, the more reliable the pattern.

With inverted head and shoulders the neckline is drawn through the highest points of the two intervening peaks. A downward sloping neckline signals continuing weakness and is less reliable as a reversal signal.
The extent of the breakout move can be estimated by measuring from the top of the middle trough up to the neckline. This target is then projected upwards from the point of breakout.

Volume Confirmation
· High volume on the first trough,
· Moderate volume on the second trough,
· High volume on the second peak,
· Low volume on the third trough, and
· A sharp increase in volume at the breakout.
Trading Signals

Go long at breakout above the neckline.
Place a stop-loss one tick below the last trough.
There is frequently a correction back to the neckline, which then acts as a support level. Go long on a reversal signal and place a stop-loss one tick below the support level.
Never trust an inverted head and shoulders pattern where the neckline is clearly descending (the second peak being lower than the first). The more level the neckline, the more reliable the pattern.
Double tops are identified by two peaks of similar height, followed by a break below the level of the intervening trough. They are treacherous to trade, partly because of their similarity to triple tops and trading ranges.

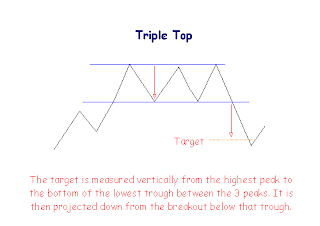
The target for a breakout move is measured ver
The target for a breakout move is measured vertically from the highest peak to the support line drawn through the intervening trough. This is then projected downwards from the breakout point.
Reduced volume on the second peak followed by increased volume on the break below the support line.
Trading Signals
Go short on a break below the support line.
Place a stop-loss just above the last peak.
Price often rallies back to the support line which then acts as a resistance level. Go short on a reversal signal and place a stop-loss just above the resistance level.
Double Bottom
Double bottoms are also treacherous to trade, in part because of the similarity to triple bottoms and trading ranges.

The target is measured from the lowest trough to the level of the intervening peak. It is then projected up from the break out above the resistance line.
Volume Confirmation
Reduced volume on the second trough followed by increased volume on the break above the resistance line.
Trading Signals
Go long on a break above the resistance line.
Place a stop-loss just below the last trough.
Price often corrects back to the resistance line which then acts as a support level. Go short on a reversal signal and place a stop-loss just below the support level.
Bearish Engulfing Pattern
The Bearish Engulfing Pattern is directly opposite to the bullish pattern. It is created at the end of an up-trending market. The black real body completely engulfs the previous day's white body. This shows that the bears are now overwhelming the bulls. 
Hammer and Hanging-man

A two-day bearish pattern found at the end of an upturn or at the top of a congested trading area. The first day of the pattern is a strong white real body. The second day's price opens higher than any of the previous day's trading range.

The Evening Star


 The Gravestone Doji is formed when the open and the close occur at the low of the day. It is found occasionally at market bottoms, but it's forte is calling market tops. The name, Gravestone Doji, is derived by the formation of the signal looking like a gravestone.
 The Long-legged Doji has one or two very long shadows. Long-legged Doji's are often signs of market tops. If the open and the close are in the center of the session's trading range, the signal is referred to as a Rickshaw Man. . The Japanese believe these signals to mean that the trend has "lost it's sense of direction."
Bearish Doji Star1st day is a long white day. 2nd day is a doji day that gaps above the 1st day. The doji shadows shouldn't be excessively long
 There are several Candlestick patterns that need to be committed to memory. The Japanese Candlestick trading signals consist of approximately 40 reversal and continuation patterns. All have credible probabilities of indicating correct future direction of a price move. The following dozen signals illustrate the major signals.
If the close is higher than the open - the candlestick mid-section is hollow or shaded whi te
If the open ite higher than the close - the candlestick mid-section is filled in or shaded black.
Candlestick
While analysis of chart patterns takes experience and some practice, so too will candlesticks. However, after learning the basic signals, candlesticks can provide the novice trader a shorter learning curve and also shorten the learning curve to chart reading in general.

The major signals in candlestick theory are reversal signals. Some of these signals are considered so strong by serious candlestick practitioners they will enter a trade based on its signal alone, without the need for conformation. Since I rarely see the price of a stock "turn on a dime", I usually keep an eye on the stock and enter a trade when the price retests support or resistance.
While I've incorporated candlestick charting into my trading strategies for quite some time, I have learned that there are a few technical criteria that will enhance the candlestick reversal signal. Some of these criteria include:
• Heavy volume on the reversal day – I look for volume to be greater than one and a half times normal volume.
• Greater than average price movement on the reversal day –look for the price to exceed its normal daily price range and appear longer on the chart than most daily candles.
• Stock price that is heavily overbought or oversold –look for the price to accelerate away, but in the same direction as the current trend.
• Signal forms on technical support –look for the reversal signal to reveal itself on a trend line, moving average or horizontal support.
While candlestick charting is enjoying a following that has grown in recent years, it should be viewed as just another tool the trader uses to profit in the market, not as a foolproof method of entering or exiting a stock. The signals tell a story of the psychology of the market. Sometimes the signals are only valid for a short period of time, but at key levels of support and resistance the reversal signals given by candlestick patterns can tip the trader off to a healthy price move.
